Surface Current in “Hotspot” Serves as a New and Effective Precursor for El Ni?o Prediction
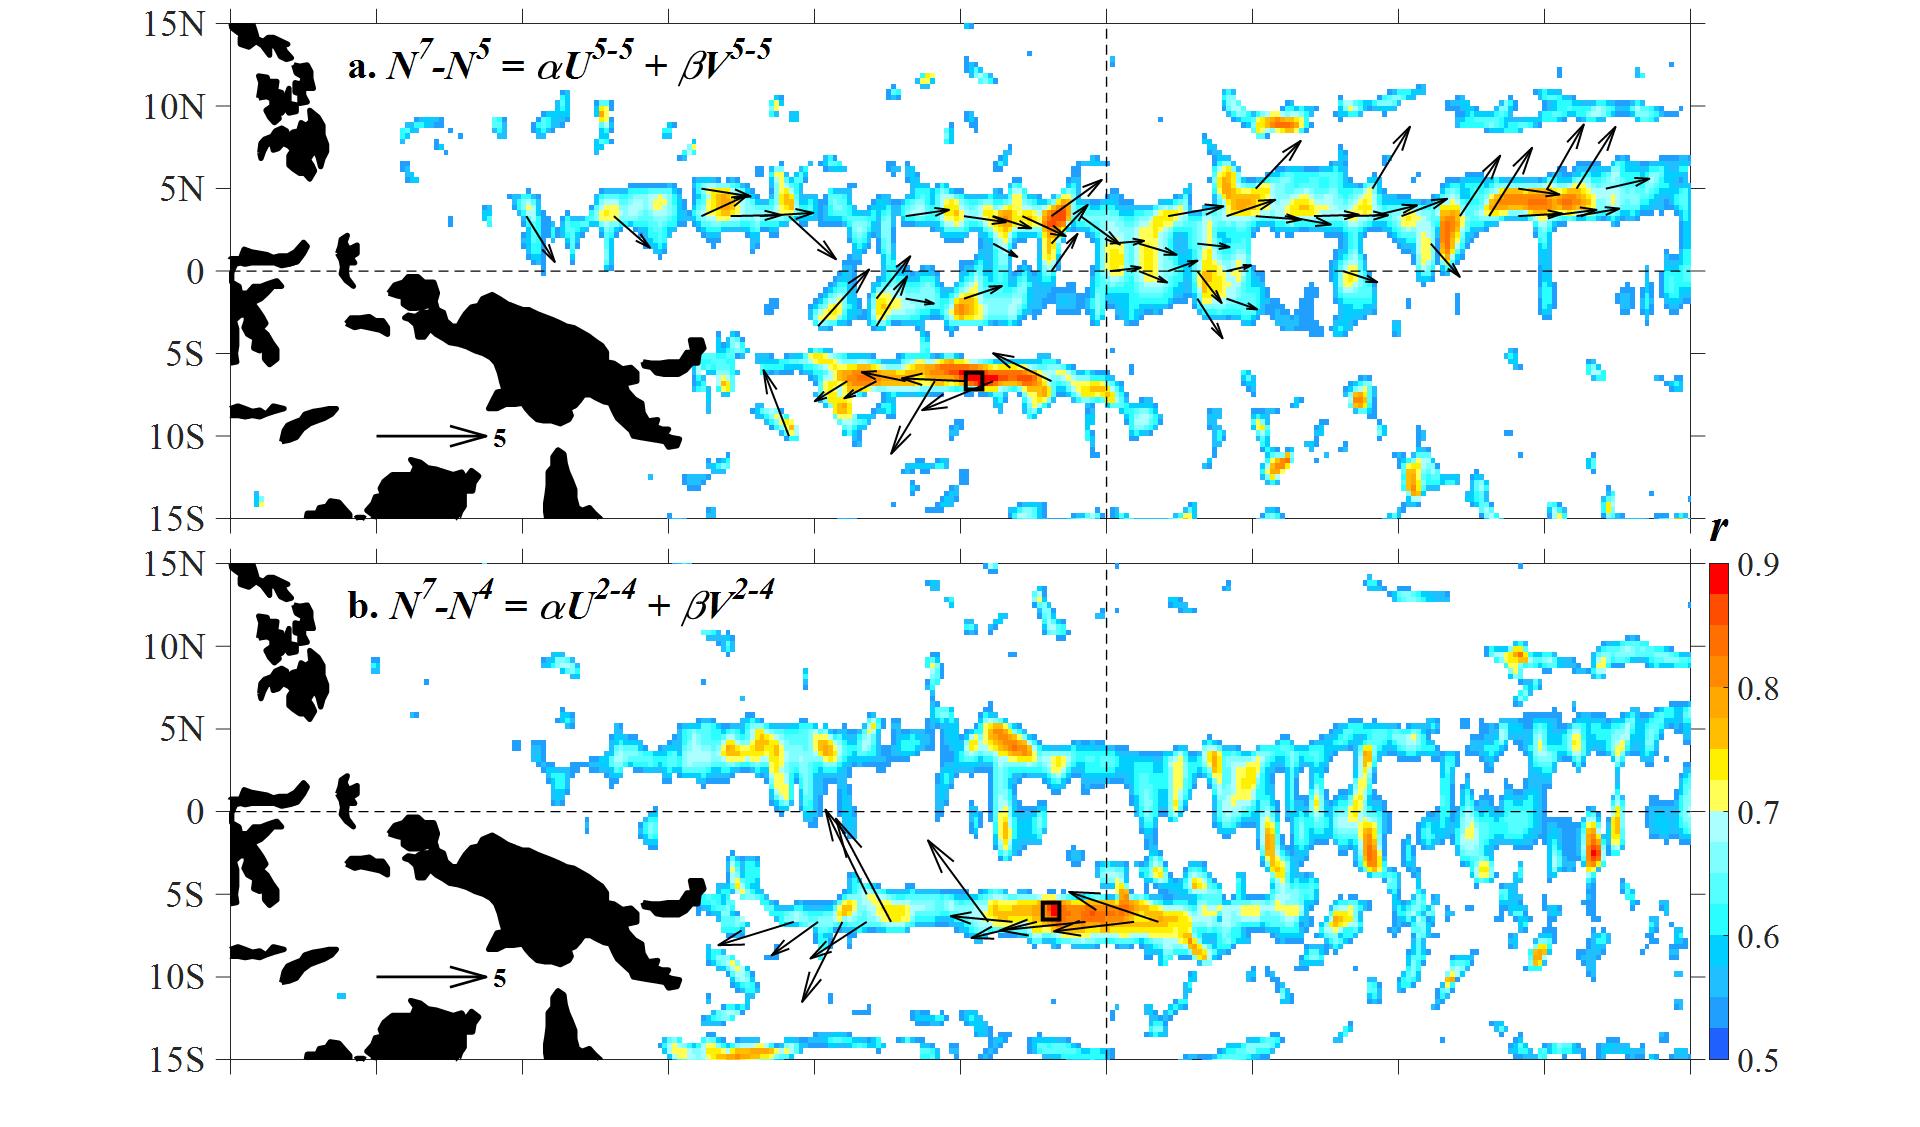
The El Ni?o and Southern Oscillation (ENSO) is the most prominent sources of inter-annual climate variability. Related to the seasonal phase-locking, ENSO’s prediction across the low-persistence barrier in the boreal spring remains a challenge. Researchers from IOCAS (Institute of Oceanology, Chinese Academy of Sciences) and BIO (Bedford Institute of Oceanography, Fisheries and Oceans of Canada) identify “hotspots” where surface current variability influences the short-lead time predictions of the July Ni?o 3.4 index by applying a regression analysis. Prior to the approaching to the “barrier” of next year (in April), predictions based on surface currents in “hotspots” are all skillful, with correlations 20% being larger than the predictions based on the warm water volume on average. Recently, this finding was published in Nature Publication Group: Scientific Reports (https://www.nature.com/articles/s41598-017-00244-2?WT.feed_name=subjects_physical-oceanography).
A highly influential region, related to the distribution of wind-stress curl and sea surface temperature, is located at the southern edge of the South Equatorial Current and between two cores of maximum sea surface temperature. During El Ni?o years, a westward current anomaly in the identified hotspot favors the accumulation of warm water in the western Pacific. The opposite occurs during La Ni?a years. This process is seen to serve as the “goal shot” for ENSO development, which provides an effective precursor for the prediction of the July Ni?o 3.4 index with a lead time of 2-4 months. The prediction skill based on surface current precursor beats that based on the warm water volume and persistence in the subsequent months after July. In particular, prediction based on surface current precursor shows skill in all years, while predictions based on other precursors show reduced skill after 2002.
Corresponding author: Fan Wang (fwang@qdio.ac.cn), Institute of Oceanology, CAS

Figure. Regression relationships between the Ni?o 3.4 index and surface currents. The hotspot is located near the dateline and the southern edge of the South Equatorial Current. Color shading: correlations (r) between annual time series of N7-Nt and regressed αUi-t+βVi-t that are significant at the 0.01 level. Vectors: regression coefficients (α, β). N7 and Nt denote the Ni?o 3.4 index in July and in month t, respectively; (Ui-t, Vi-t) denote surface currents averaged from month i to t. a, t = i = 5 (May). b, t = 4 (April) and i = 2 (February).

